
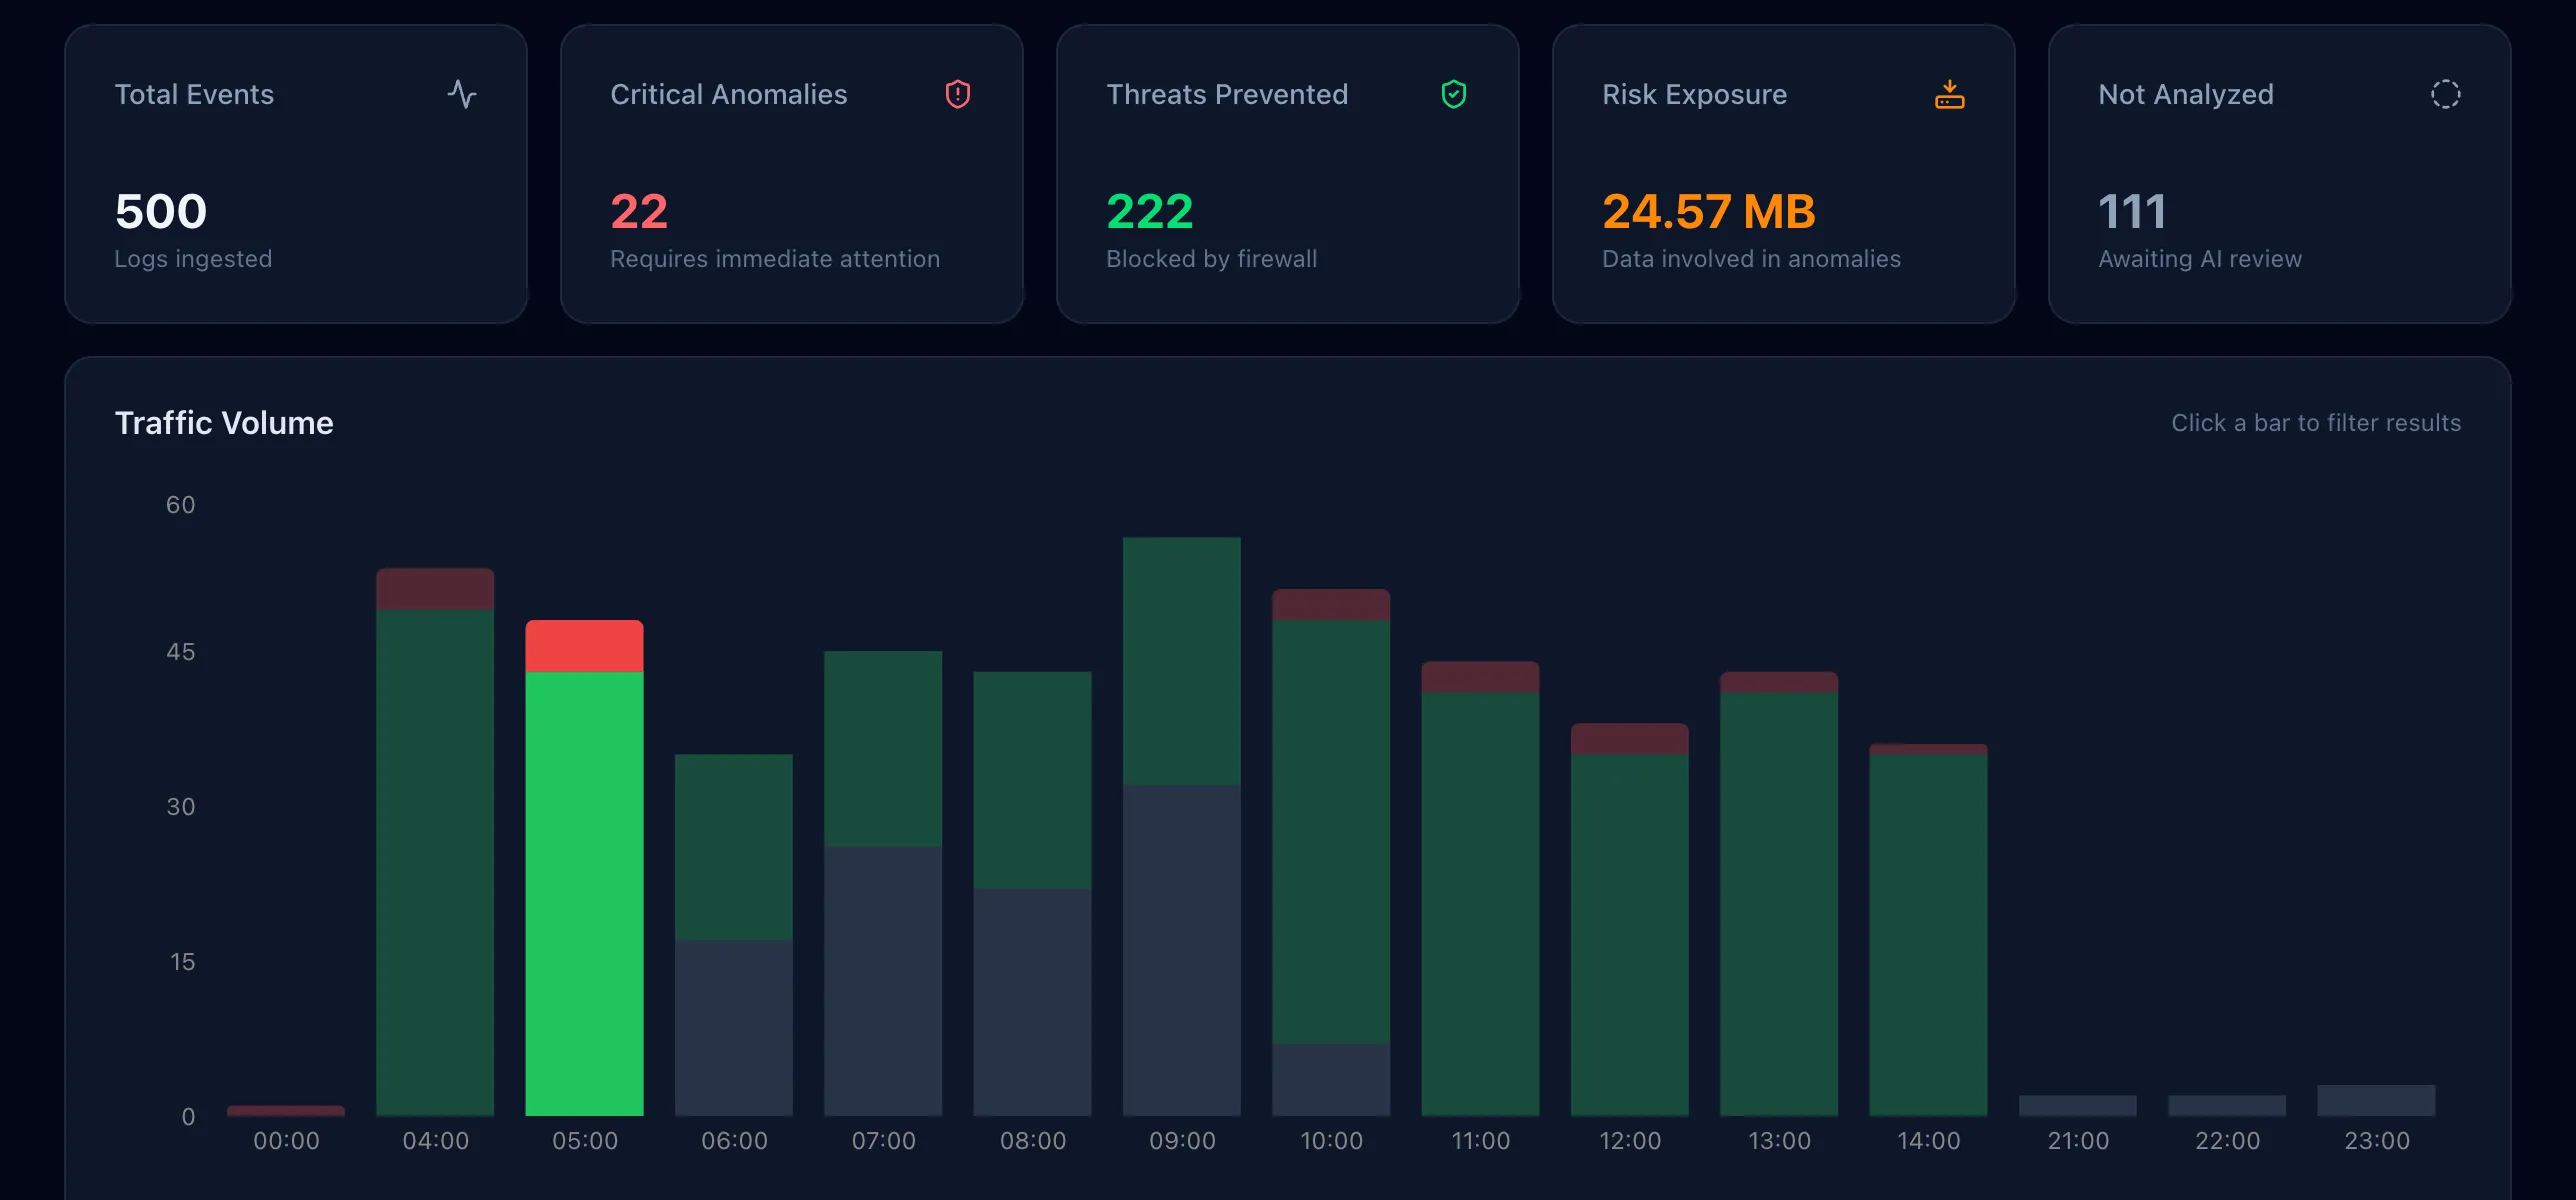
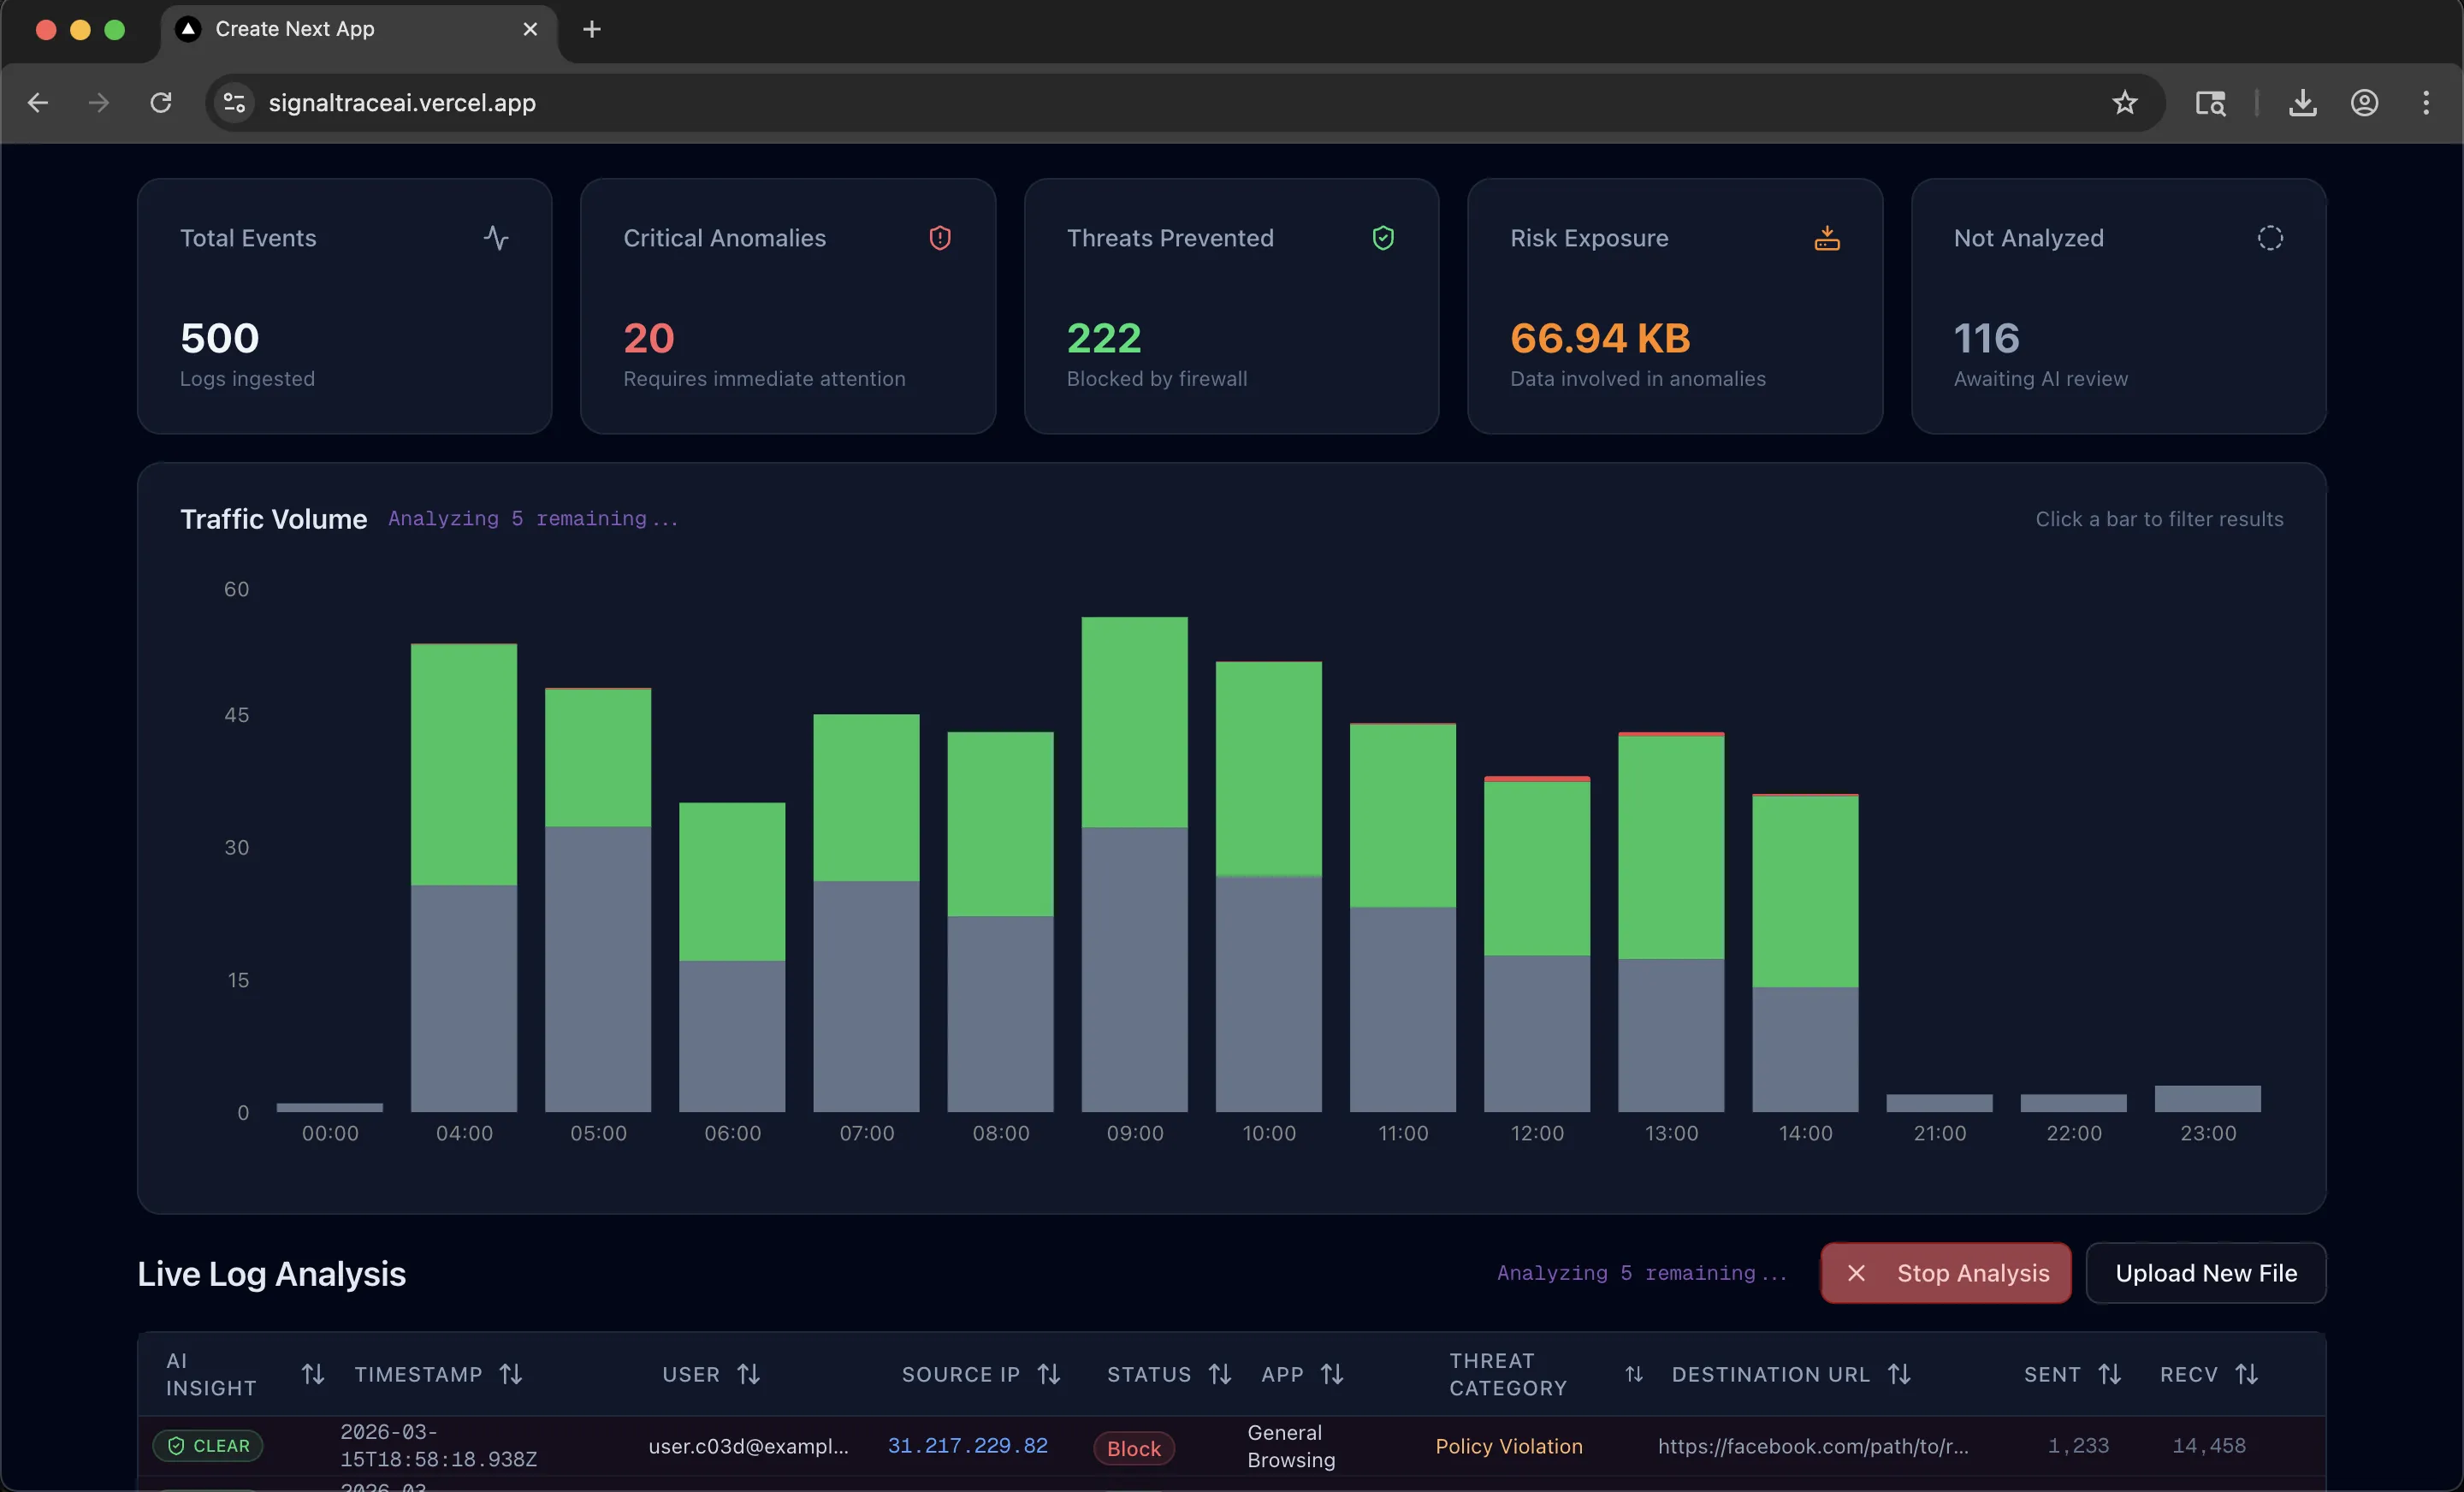
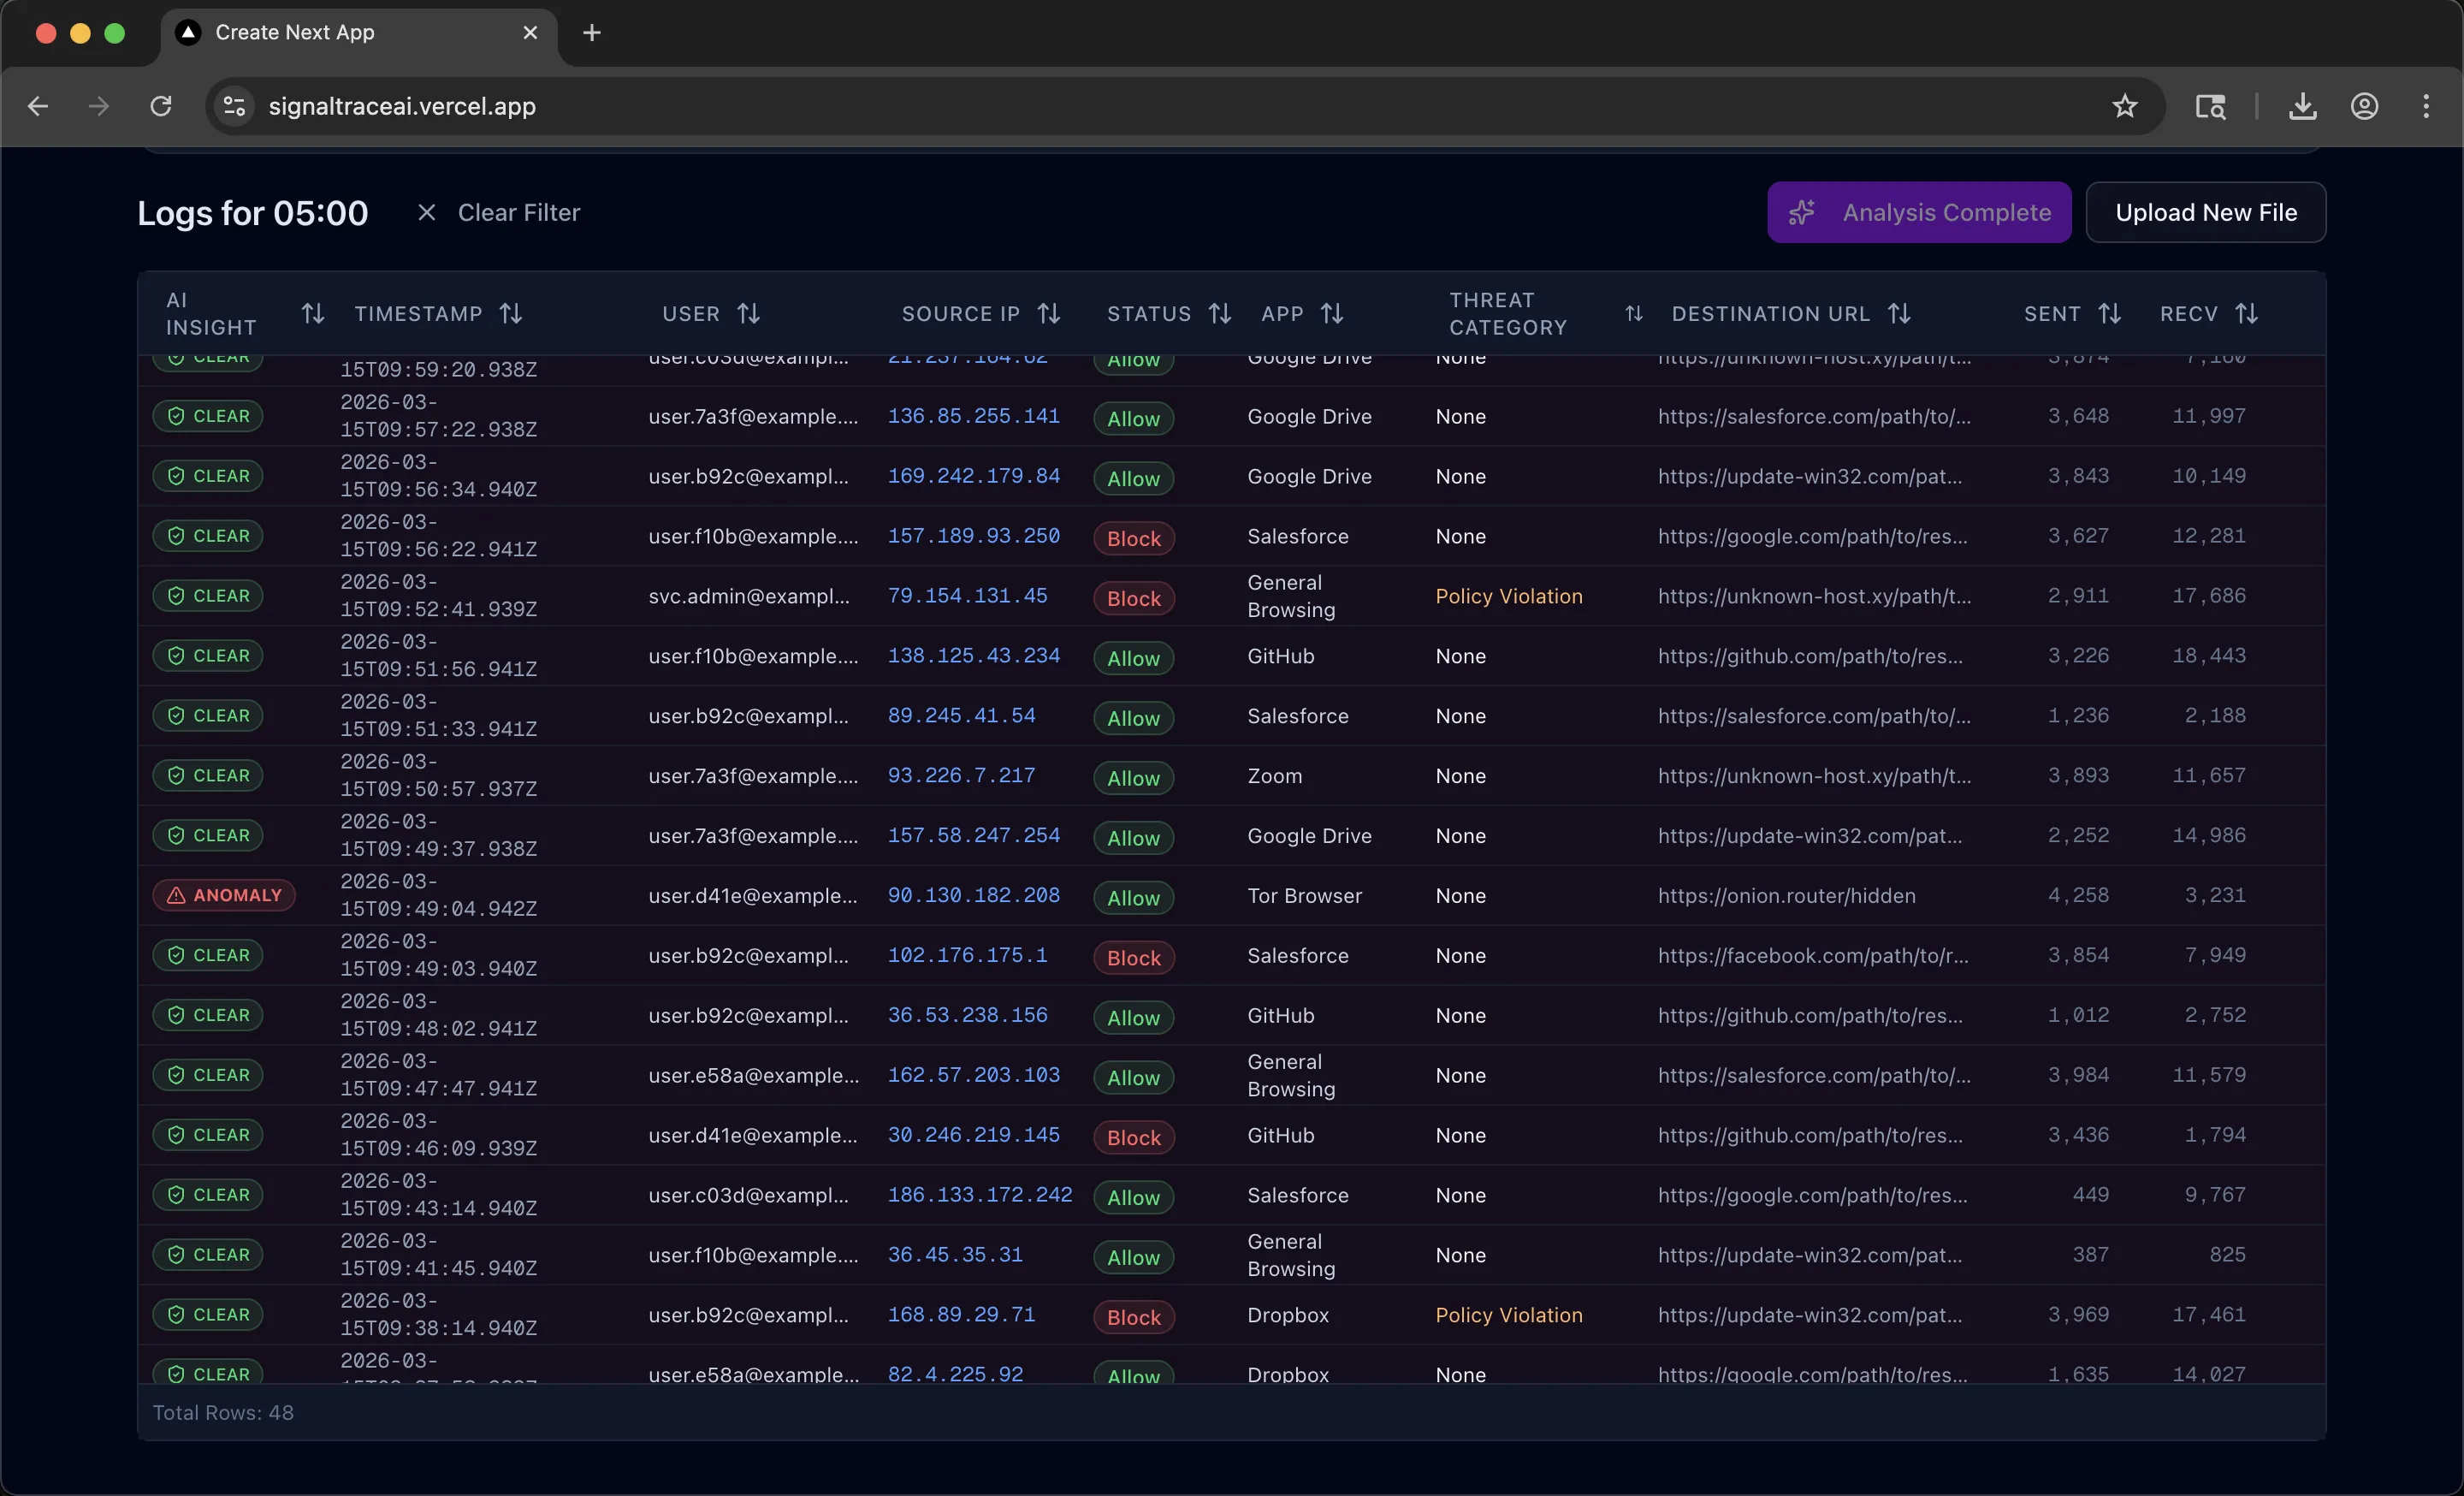
Full Dashboard: Stacked threat chart, summary cards, and virtualized log table after AI analysis.
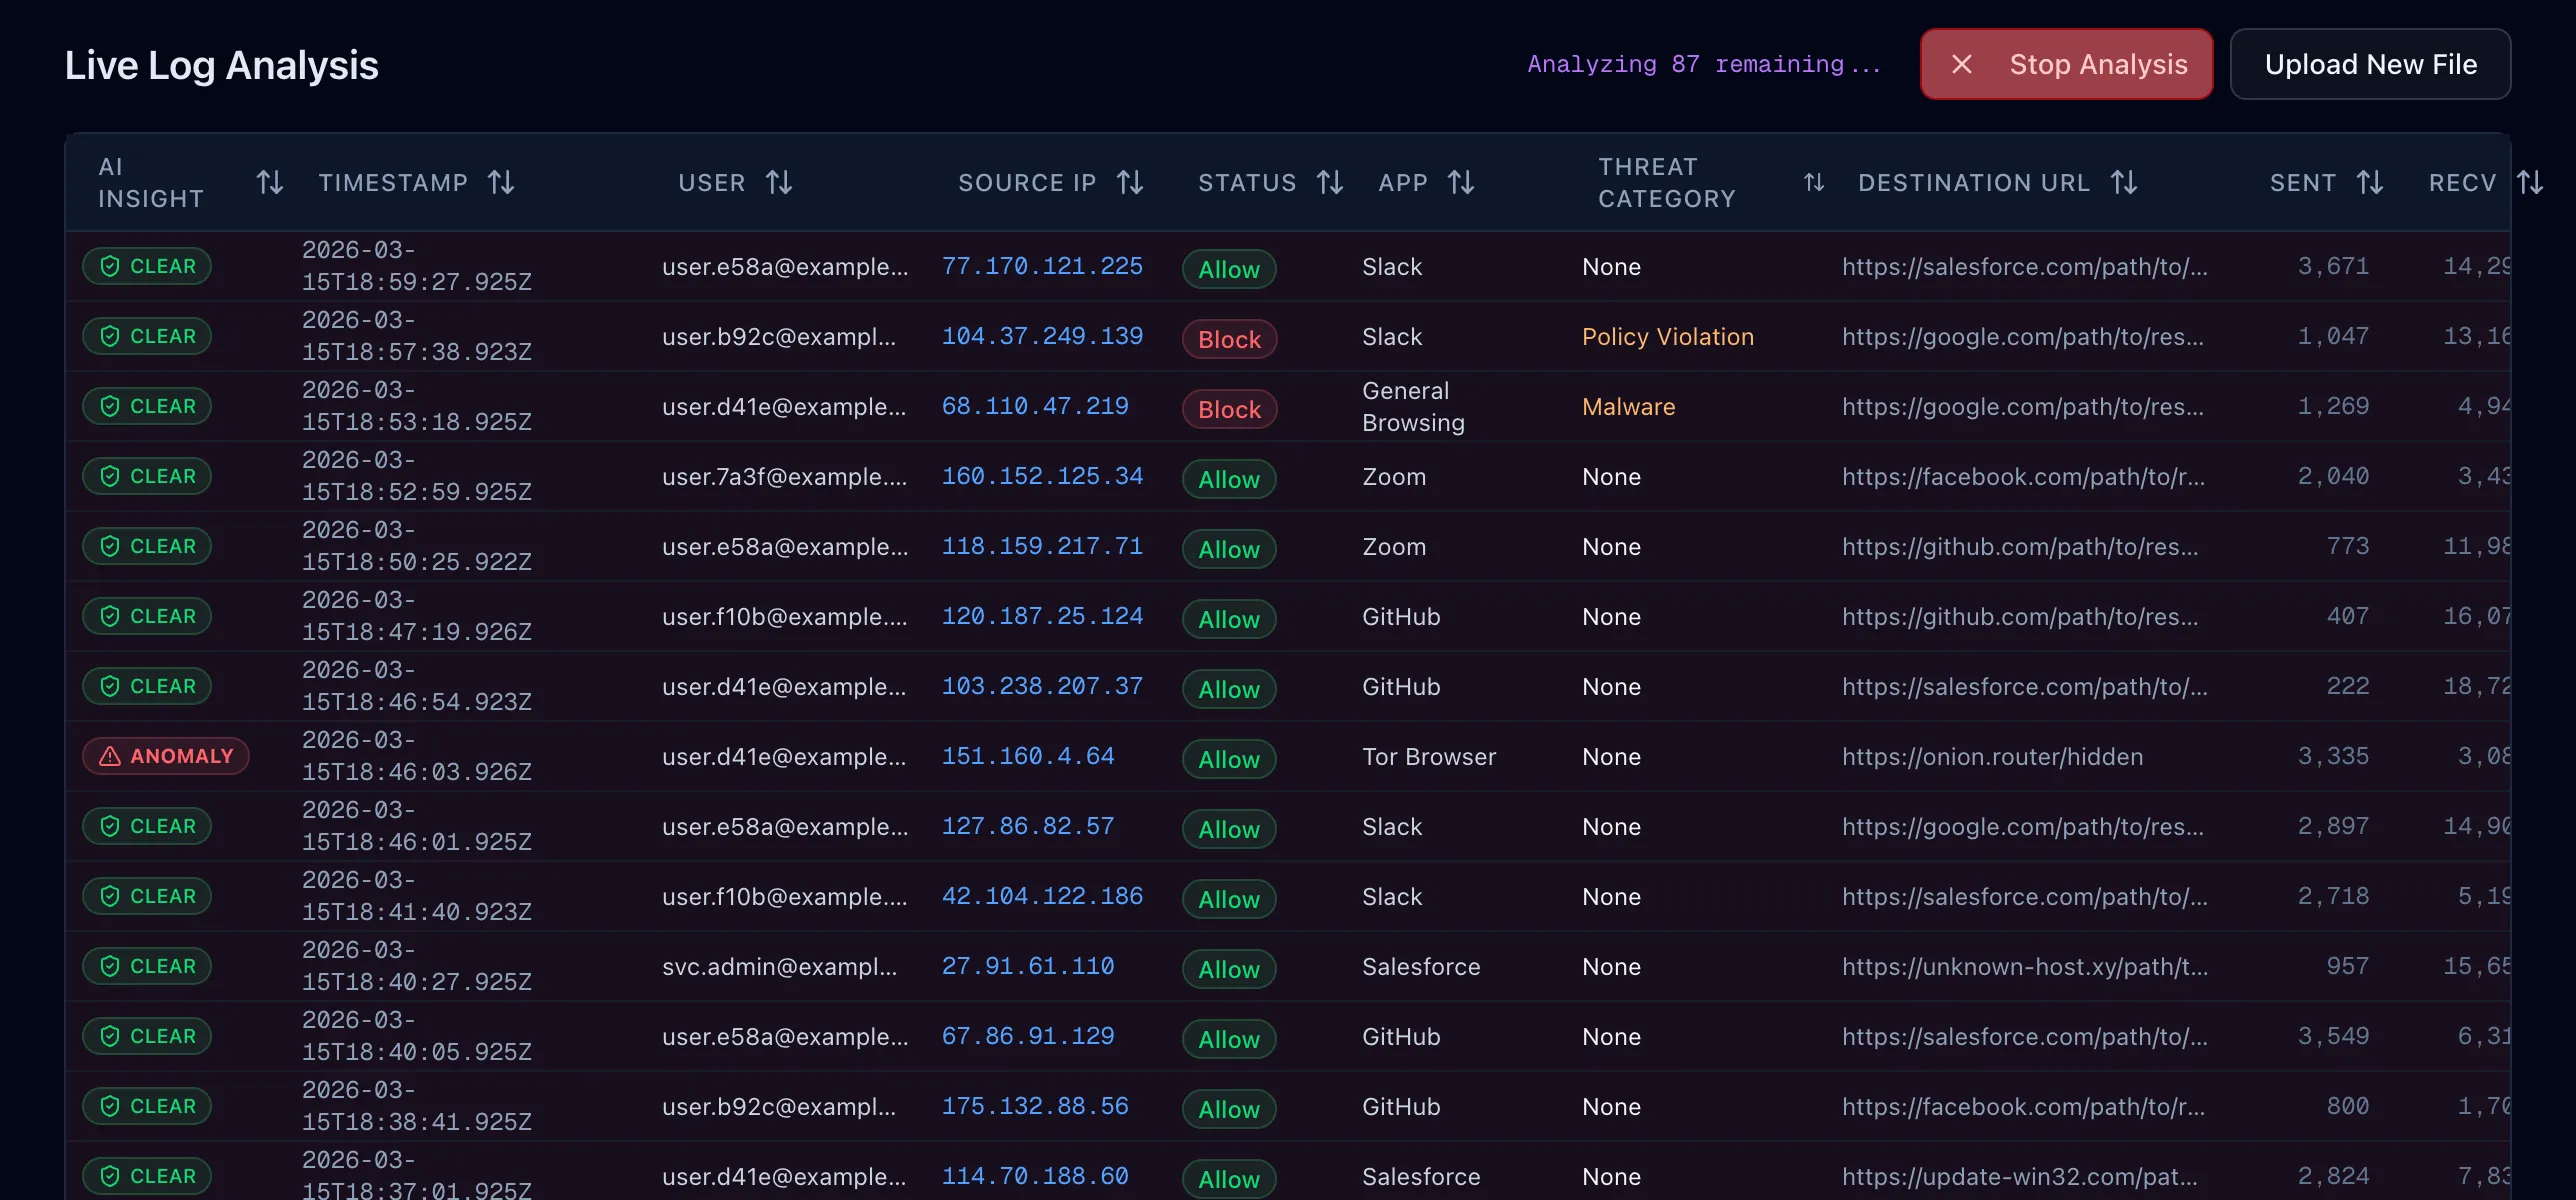
Live Streaming: Chart and table update in real time as each log is analyzed over NDJSON.
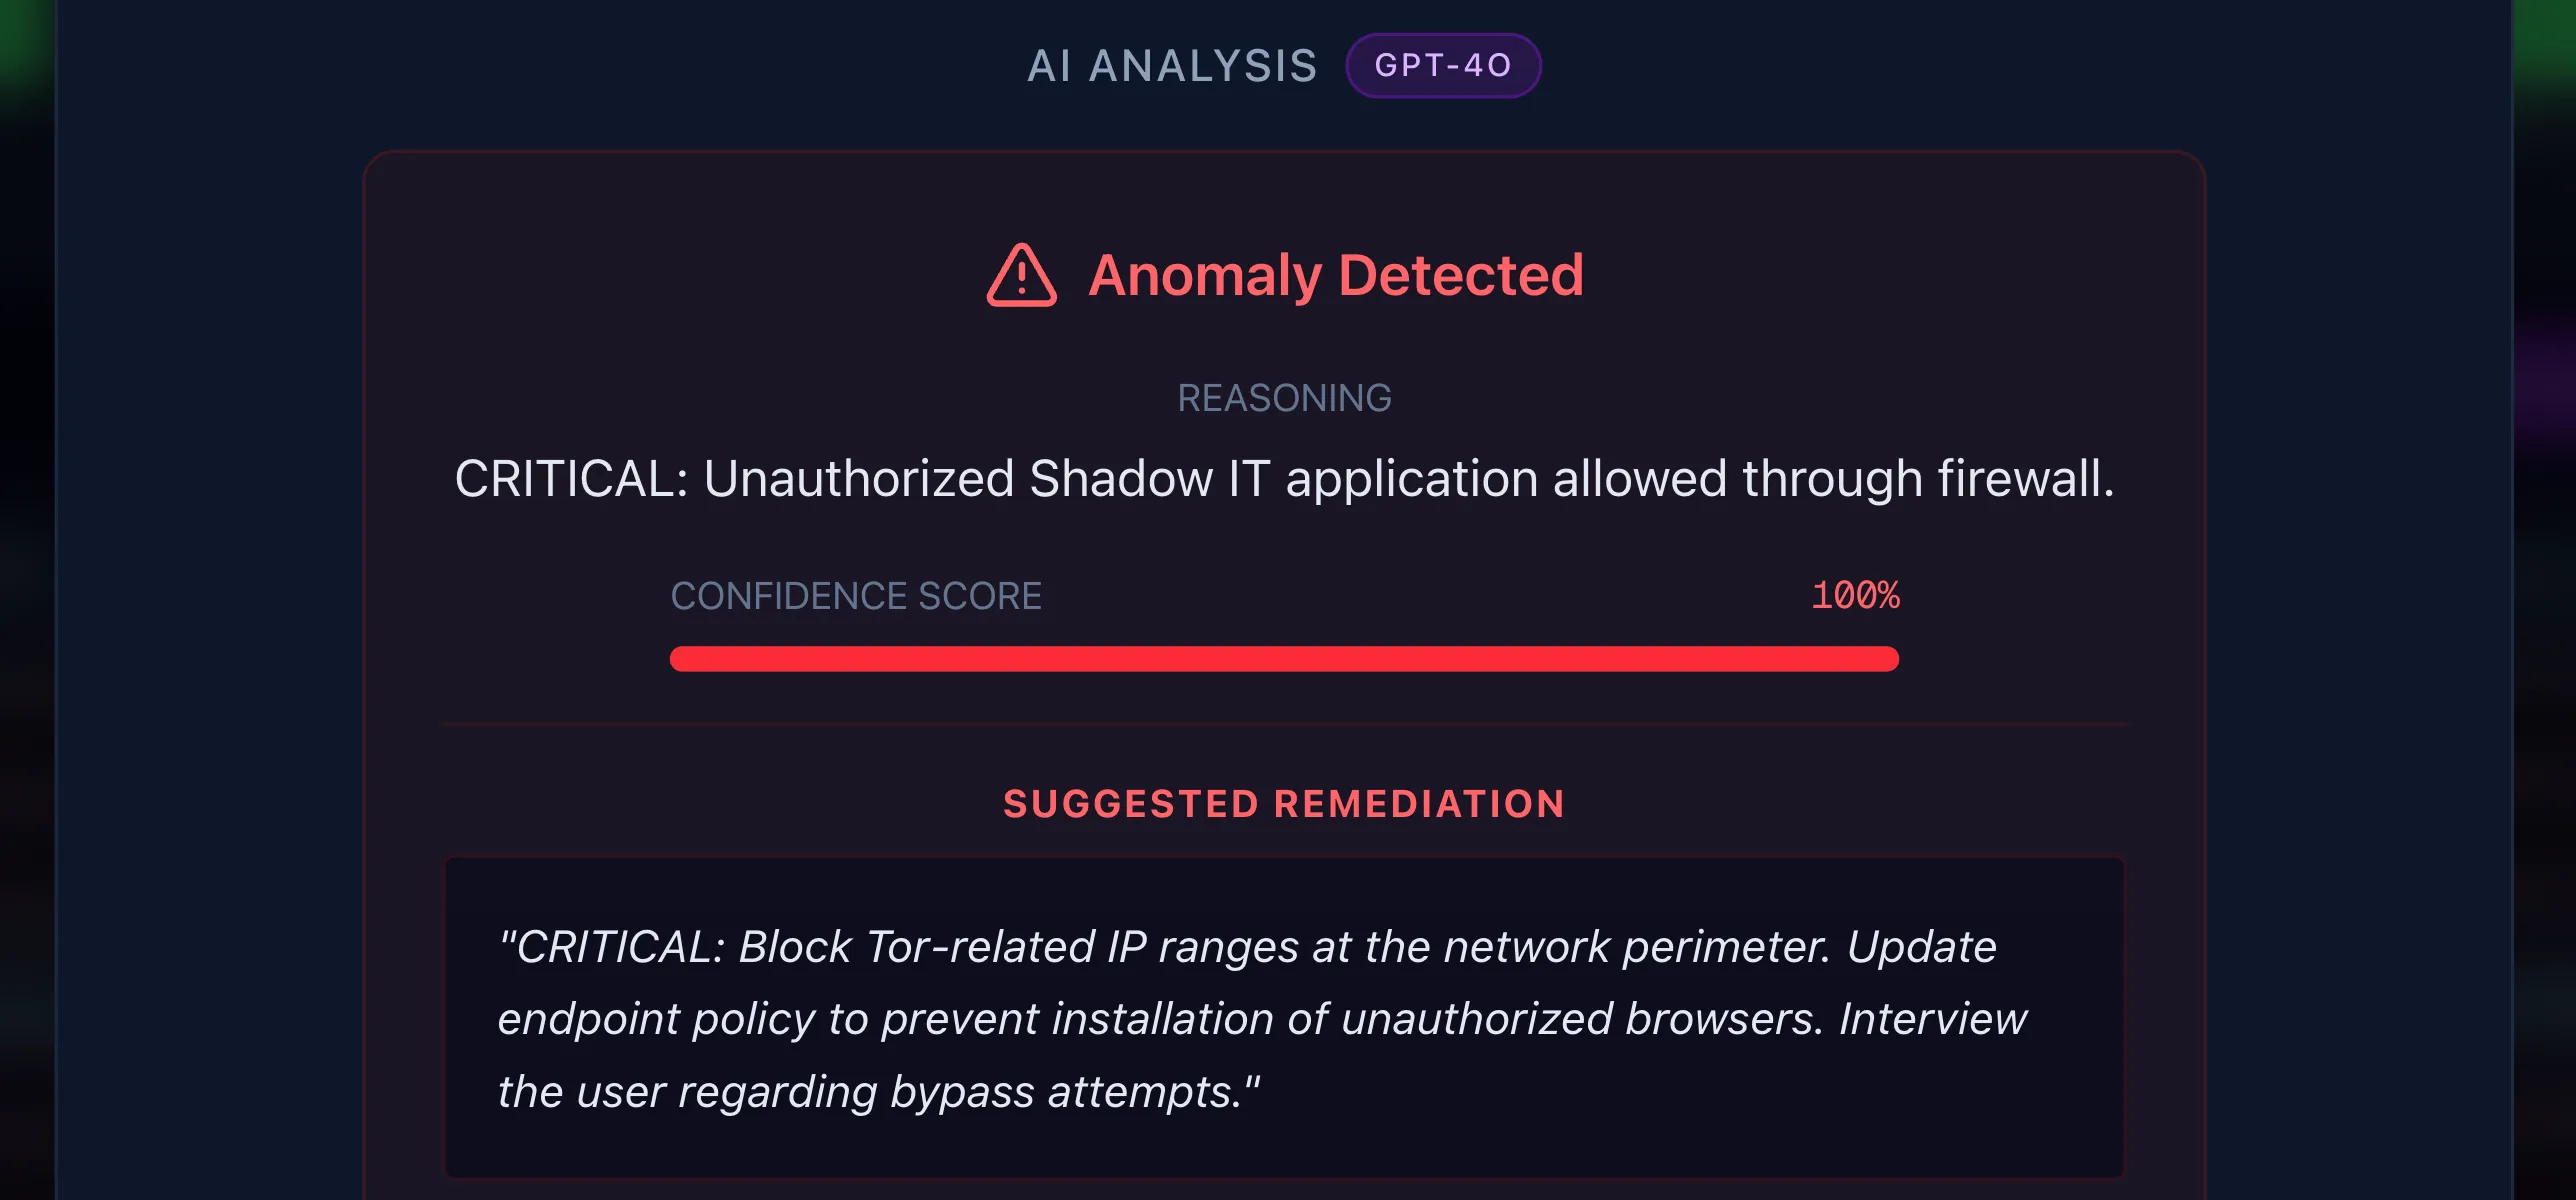
Deep Dive: AI reasoning, confidence scoring, and on-demand remediation for flagged anomalies.
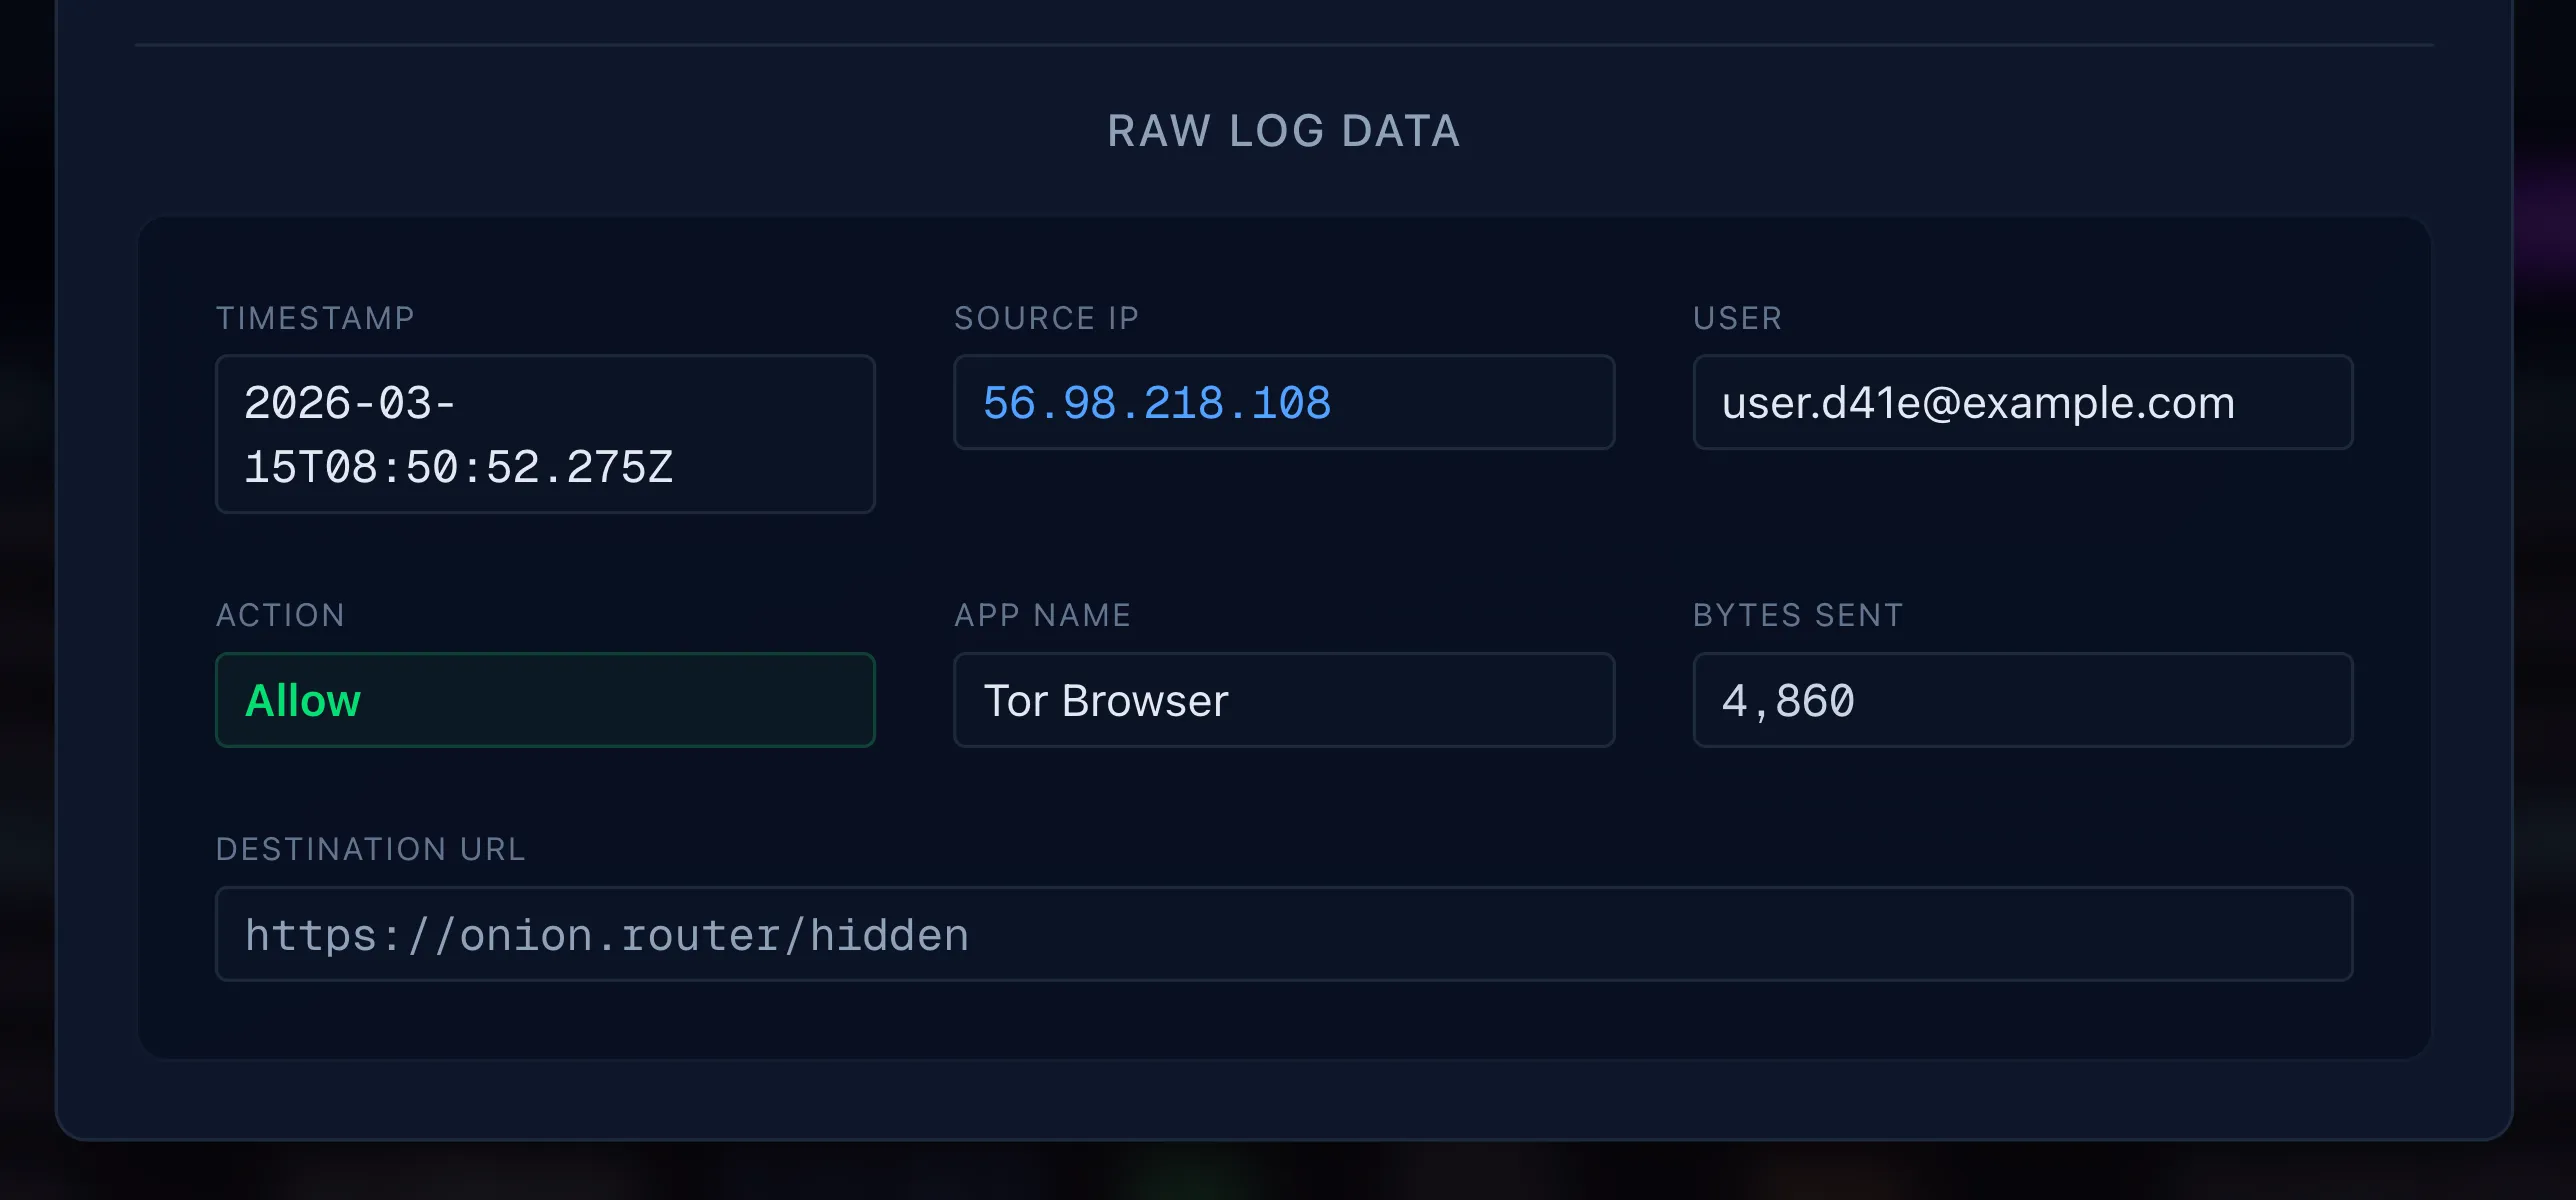
Raw Log Detail: Full log entry data for analyst verification alongside AI assessment.
SignalTraceAI: Real-Time Threat Intelligence for SOC Analysts
A streaming AI dashboard that parses ZScaler web proxy logs, detects Shadow IT, data exfiltration, and malware in real time, and gives SOC analysts interactive tools to triage threats without leaving the browser. The entire experience works with or without an API key — no setup required to evaluate.
Security operations centers deal with massive volumes of web proxy logs. Analysts need to spot the handful of genuinely dangerous events buried in thousands of routine entries, and they need to do it fast. SignalTraceAI is a threat intelligence platform that automates this triage process: upload a ZScaler CSV (or generate demo data instantly), and the system parses, visualizes, and runs AI-powered anomaly detection across the entire dataset.
The dashboard surfaces five key metrics at a glance — total events, critical anomalies, threats blocked by perimeter controls, aggregate data exposure from allowed anomalies, and logs still awaiting analysis. Each metric card is clickable and composes with hour-based chart filtering, so an analyst can ask "show me only the critical anomalies that occurred between 1 and 4 AM" with two clicks. Clicking any row opens a detail modal with the AI's reasoning, a 0–100 confidence score, and an on-demand remediation recommendation.
Engineering Challenges
NDJSON Streaming Architecture
The central technical challenge was making AI analysis feel instantaneous on a dataset of 500+ logs. A traditional request-response pattern would leave the analyst staring at a spinner for the entire analysis duration. Instead, I built a streaming pipeline using Newline-Delimited JSON (NDJSON): the server sends a metadata frame with the expected result count, then streams each analysis result as its own JSON object separated by newlines.
On the client side, a custom stream parser reads from a ReadableStream,
buffers incomplete chunks across network boundaries, and fires a callback for
each complete result. The bar chart, summary cards, and data table all update
live as results arrive. The analyst sees threats surface in real time and can
click into any flagged entry before the full analysis finishes. An
AbortController allows mid-stream cancellation without server-side
cleanup, so the analyst stays in control throughout.
The complexity is in the edge cases: handling JSON fragments split across TCP packets, filtering out markdown code fences that OpenAI occasionally injects into streamed responses, and keeping the chart's stacked segments and the table's status badges in sync as results arrive asynchronously.
Blocked-Log Optimization
Not every log needs AI analysis. Logs where the ZScaler proxy already blocked the request represent threats that were mitigated by perimeter controls — sending them to the LLM wastes tokens and delays results for the entries that actually matter. I built a pre-processing step that instantly resolves all blocked logs as "Clear" on the client before the streaming analysis begins. This means the analyst sees immediate feedback on the majority of their dataset, and the AI focuses exclusively on allowed traffic where real risk exists.
Virtualization Over Pagination
SOC analysts need to correlate events across time ranges — pagination breaks this workflow by hiding data behind page boundaries. I used TanStack Virtual to render only the visible rows (with a 10-row overscan buffer), keeping the full dataset in memory for instant sorting and filtering. Combined with TanStack Table for column management and sorting, the grid handles hundreds of rows with no perceptible lag. The trade-off is higher client memory usage, but for the dataset sizes this tool targets, it's the right call over server-side pagination.
Composable Cross-Filtering
The dashboard supports two independent filter axes that compose together: card filters (by analysis status) and hour filters (by clicking chart bars). Each axis is independently toggleable — clicking the same card or bar a second time deselects it. When an hour is selected, unselected bars dim to 30% opacity for visual context. Both filters apply simultaneously to the table, the chart highlighting, and the summary card calculations. All filtering happens client-side against the in-memory dataset, so interactions are instantaneous.
Dual-Mode AI Engine
The app was designed to be evaluated without an OpenAI API key. Rather than treating the no-key path as a degraded fallback, I built a deterministic mock engine that replicates the real AI prompt's detection logic: it flags Tor Browser as Shadow IT, identifies high-volume Dropbox uploads during off-hours as data exfiltration, catches suspicious user agents (Python, curl, PowerShell), and scores confidence levels that match the LLM's output patterns. The mock engine streams results with simulated latency, so the UI behavior — live chart updates, progress indicators, stream cancellation — is identical in both modes. Reviewers get the full experience with zero cost and zero configuration.
In real AI mode, the system sends the first 50 logs plus all off-hours entries to GPT-4o-mini via streaming, optimizing token usage while ensuring the highest-risk time windows are always analyzed.
Architecture Decisions
In-Memory State Over Database Persistence
I deliberately chose a session-based, in-memory architecture. CSV data is parsed server-side and returned as JSON; analysis results live in React state for the session. A page refresh clears everything. This was a conscious scope decision to keep the frontend experience polished within a tight build timeline. The planned next step is Zustand with localStorage persistence to survive refreshes without requiring a full database layer.
Human-in-the-Loop Design
The AI highlights anomalies. The analyst verifies. Every flagged entry shows the AI's reasoning and confidence score alongside the raw log data, so the analyst can validate the assessment against the source. Remediation suggestions are fetched on demand via a separate API call — the analyst requests them, not the system. This keeps the tool positioned as a force multiplier, not a replacement for analyst judgment.
Technical Summary
- 4 API routes — CSV upload with schema validation, demo data generation, NDJSON streaming analysis, and on-demand remediation.
- Real-time streaming — Custom NDJSON parser with buffer management, chunk reassembly, and graceful error handling for malformed LLM output.
- Virtualized rendering — TanStack Virtual + TanStack Table for smooth scrolling over large datasets with sortable columns and status badges.
- Interactive visualization — Recharts stacked bar chart with per-cell opacity control, hour-based click filtering, and live color updates during streaming.
- Strict TypeScript — No
anytypes. Type guards for CSV parsing. Defined interfaces for all data structures. - Zero-config demo — Full-fidelity mock engine with deterministic threat detection, simulated streaming latency, and mock remediation responses.
Project information
- Category: AI / Cybersecurity
- Role: Solo Engineer (Design through Deployment)
- Technologies: Next.js 14 (App Router), React 19, TypeScript (strict), Tailwind CSS, shadcn/ui, TanStack Table, TanStack Virtual, Recharts, OpenAI API (gpt-4o-mini), NDJSON Streaming, PapaParse, Vercel
- Live Demo (login: admin / demo123)
- GitHub
- Video Walkthrough